

For the Love of God, Please Don’t Overinterpret Early Voting
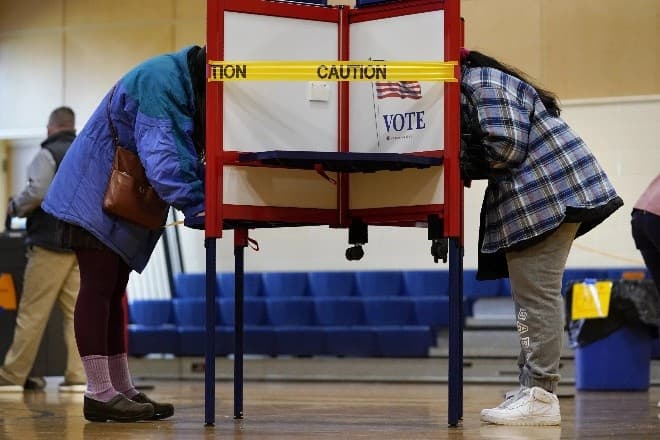
Every two years, we reach September of the election year, and something terrible happens. Early voting begins. I don’t mean that early voting is terrible for voters or democracy or anything like that—I actually support early voting periods (of reasonable length). I mean that it is terrible for analysts.
It’s terrible for analysts because the data it produces is irresistible, addictive, and flawed. Why do analysts find it irresistible and addictive? Consider our plight. We spend years following every twist and turn as the election develops, while everyday citizens go about their lives. We can recite every candidate’s foibles as if they were a catechism, and we religiously await the dropping of the next poll, even as we understand the design limitations and inherent uncertainties that accompany modern polling. But once the early votes start to trickle in? We get something sorely lacking: actual election data.
It is tempting to start drawing strong conclusions about the general election from these data. I am extremely tempted to do this. So, by October of the election year, I find myself writing some variant of this piece (for a decade now), urging you to please refrain from overinterpreting early voting (with one notable exception).
The reason for this is straightforward. Election results can be thought of as a sort of formula. You take a party’s share of the early vote and multiply it by the number of votes cast before Election Day, and then add the product of the party’s share of the Election Day vote and the number of votes cast on Election Day. This gives you the party’s overall vote total. So if you know these four quantities (number of early votes, number of Election Day votes, Party A’s share of early votes, Party A’s share of Election Day votes), you can figure out the election result.
Here’s the rub: Early voting gives us only one of those quantities, and only after early voting wraps up. All we really know is the number of early votes at a given point in time. Now we can use demographics and past precinct results to estimate the voting patterns of individuals who have returned ballots or who are identified as having voted early, but these are estimates. Worse, we know relatively little about the composition of the Election Day electorate.
This gets even more complicated because parties change strategies, and turnout patterns change. Early voting was a Republican-dominated affair in the 2000s, until Barack Obama’s campaign figured out it could use early voting to lock in voters, freeing up resources to target more difficult-to-reach voters on Election Day. This shift was compounded in Donald Trump’s first two campaigns when he (much to his advisors’ chagrin) urged his voters not to use early voting. In 2024, his campaign concluded that one of the party’s failures in 2022 was the lack of emphasis on early voting, and so the party changed its strategy. Early voting surged.
The upshot is that we lack a straightforward, stable baseline for cross-race comparisons. We see this in some online debates. You can compare early vote return rates to the rates at a similar point in 2022, but you’ll miss the shift in Republican strategy that occurred in 2024 (assuming that strategy carries over to this year). You can use 2024 as a baseline, but that requires comparing presidential years to midterm years, and 2024 could have been a one-off aberration in GOP voting patterns, with mean reversion this year.
On top of all of this, even if we somehow get the turnout rates right, we still don’t really know how these voters are going to vote. We can generate estimates based on poll data, demographics, and precinct characteristics, but we start piling inference upon inference to get our final estimate.
What you end up with is something of a Choose-Your-Own-Adventure approach to interpretation. I’ve written about this before, but humans are programmed to find patterns; it is one reason for our phenomenal success as a species. It’s how we figure things out. The problem is that we are all a bit overprogrammed to discover these patterns. It’s called “apophenia.” It’s why we find a man’s face on the moon or an image of Elvis in a potato chip or an image of Mary in our toast. In its more extreme forms, it is why we become conspiracy theorists, or why a gambler becomes convinced after sequential losses that she “is due.” ...
State of Union
.